Figures analysis: January to September hallmarking jumps 19%
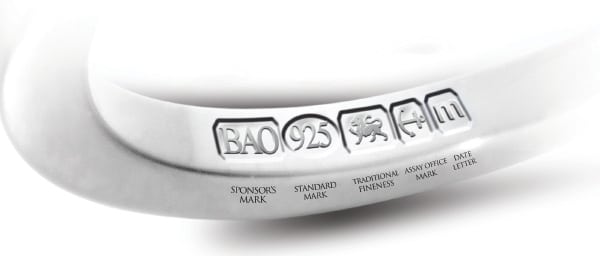
Overall hallmarking figures have shown an increase of almost 19% in the first nine months of 2014, compared with the same period the previous year.
So far the biggest year-on-year increases on a by-month basis were January and May, which increased 31% and 27% respectively compared with their corresponding time periods the previous year.
The total number of items hallmarked during this nine month period has risen by 1.13 million, from 5.99 million in 2013 to 7.11 million this year.
The smallest increase so far this year has been July, but this still marked a 9% rise compared with 2013. Analysts are confident of a retail boom for the Christmas season this year, and it is thought October and November hallmarking figures are likely to reflect strong stock-buying by retailers ahead of the festive rush.
2013 | 2014 | Difference | % change | |
January | 615,271 | 803,749 | 188,478 | 31% |
February | 591,310 | 704,921 | 113,611 | 19% |
March | 600,361 | 728,256 | 127,895 | 21% |
April | 612,989 | 737,316 | 124,327 | 20% |
May | 586,903 | 747,201 | 160,298 | 27% |
June | 661,162 | 764,387 | 103,225 | 16% |
July | 796,893 | 871,830 | 74,937 | 9% |
August | 706,763 | 794,964 | 88,201 | 12% |
September | 810,409 | 957,509 | 147,100 | 18% |
TOTAL | 5,982,061 | 7,110,133 | 1,128,072 | 18.85% |