


Register to get 2 free articles
Reveal the article below by registering for our email newsletter.
Want unlimited access? View Plans
Already have an account? Sign in
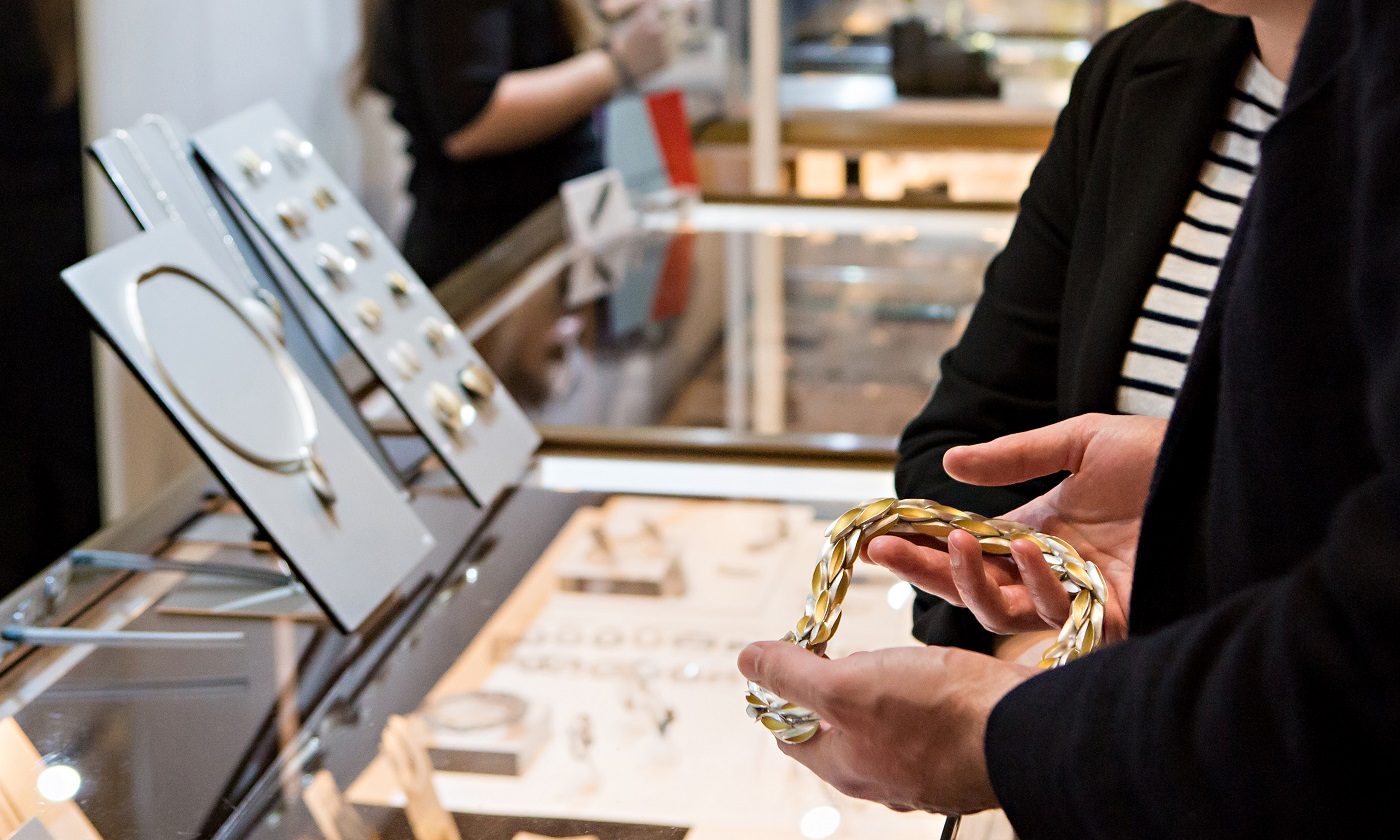
Anyone with eyes and ears has now at least heard of search engine optimisation (SEO), and the savvier business people out there have long been at work trying to improve theirs as a way of attracting more customers. Here, INSIDE ONLINE offer their insights on how jewellery brands are performing in the traffic-hunting stakes.
The jewellery industry is one of the most dynamic sectors in the UK retail trade. During the Christmas trading period online spending saw the strongest year-on-year increase since April 2012, according to the latest data from Barclaycard.
The data reveals that total retail spending grew 4.0% year-on-year over Christmas and was driven entirely by online shopping which jumped 17.9% while the high street suffered tough trading conditions, with in-store spending growth almost static at 0.2 per cent.
Chris Wood, chief operating officer at Barclaycard comments: “In many ways, this Christmas brought to the fore all the shopping trends of 2015. The large spikes in spending, centred around sales days like Black Friday, emphasise consumers’ increasing search for value as they
hold back their spending until the best deals emerge.
As the trends graph displays, the industry has seen a YOY increase in search visibility for Diamond related search terms and is forecast to increase through 2016. Therefore, companies must ensure they are visible within the search engines by making sure the SEO and content marketing campaigns they employ outperform the stiff competition.
Brand Searches Per Month
The graph below shows how the UK weekly search volume for diamonds compares between 2014 and 2016. The data has been normalised, therefore the trend lines show the percentage of peak search volume (y axis). The trend lines are designed to give some insight into what has been a turbulent year for online retail as a whole.
Diamond Search Volume Trends
It is important to highlight that the above seasonal trend is just for a single keyword. The trend shown is unlikely torepresent the overall search volume within the industry. If the search volume for the keyword above is down year on year, it may be that the search volume within longer-tail queries has increased.
Visibility year on year
So what does this mean? Every market has a level of growth and opportunity, here we can see how domains have fared compared to the whole market. A domain may have increased over the year, but if the market has grown by a greater margin – has there been an opportunity lost?
Organic Search (Visibility Year On Year)
2015 saw fewer updates than in previous years from Google. The largest updates included Panda 4.2 in July and the mobile update AKA ‘Mobilegeddon’ in April. These updates are most likely to have an effect on a domains visibility.
Other factors such as site changes (expanding or reducing site size for example) or making significant structure changes are other common reasons for observing big increases or decreases in organic visibility.
Rate of link acquisition
The greater the number of links a site has pointing towards it tends to correlate with the authoritativeness of the domain, which in turn tends to correlate with organic visibility.
Therefore, not only is the current state of a domains link profile important, it is also vital to understand who is building new links the quickest (and how they are doing it!). The graph below shows the average rate at which each domain has acquired new links over the last 11 months. The source of this data is Majestic SEO.
Average Monthly Rate of Link Acquisition
As a general rule, the larger brands manage to obtain the highest number of links per month due to their ability to naturally gather links. If smaller brands are managing to gather links at a higher rate, it could be that aggressive link manipulation is taking place.